Background:
Analysis of gene expression data using genome-wide microarrays is a technique often
used in genomic studies to find coexpression patterns and locate groups of co-
transcribed genes. However, most studies done at global “omic” scale are not focused
o n human samples and when they correspond to human very often include
heterogeneous datasets, mixing normal with disease-altered samples. Moreover, the
technical noise present in genome-wide expression microarrays is another well
reported problem that many times is not addressed with robust statistical methods, and
the estimation of errors in the data is not provided.
Methodology/Principal Findings:
Human genome-wide expression data from a controlled set of normal-healthy tissues is
used to build a confident human gene coexpression network avoiding both pathological
and technical noise. To achieve this we describe a new method that combines several
statistical and computational strategies: robust normalization and expression signal
calculation; correlation coefficients obtained by parametric and non-parametric
methods; random cross-validations; and estimation of the statistical accuracy and
coverage of the data. All these methods provide a series of coexpression datasets
where the level of error is measured and can be tuned. To define the errors, the rates
of true positives are calculated by assignment to biological pathways. The results
provide a confident human gene coexpression network that includes 3327 gene-nodes
and 15841 coexpression-links and a comparative analysis shows good improvement
over previously published datasets. Further functional analysis of a subset core
network, validated by two independent methods, shows coherent biological modules
that share common transcription factors. The network reveals a map of coexpression
clusters organized in well defined functional constellations. Two major regions in this
network correspond to genes involved in nuclear and mitochondrial metabolism and
investigations on their functional assignment indicate that more than 60% are house-
keeping and essential genes. The network displays new non-described gene
associations and it allows the placement in a functional context of some unknown non-
assigned genes based on their interactions with known gene families.
Conclusions/Significance:
The identification of stable and reliable human gene to gene coexpression networks is
essential to unravel the interactions and functional correlations between human genes
at an omic scale. This work contributes to this aim, and we are making available for the
scientific community the validated human gene coexpression networks obtained, to
allow further analyses on the network or on some specific gene associations.
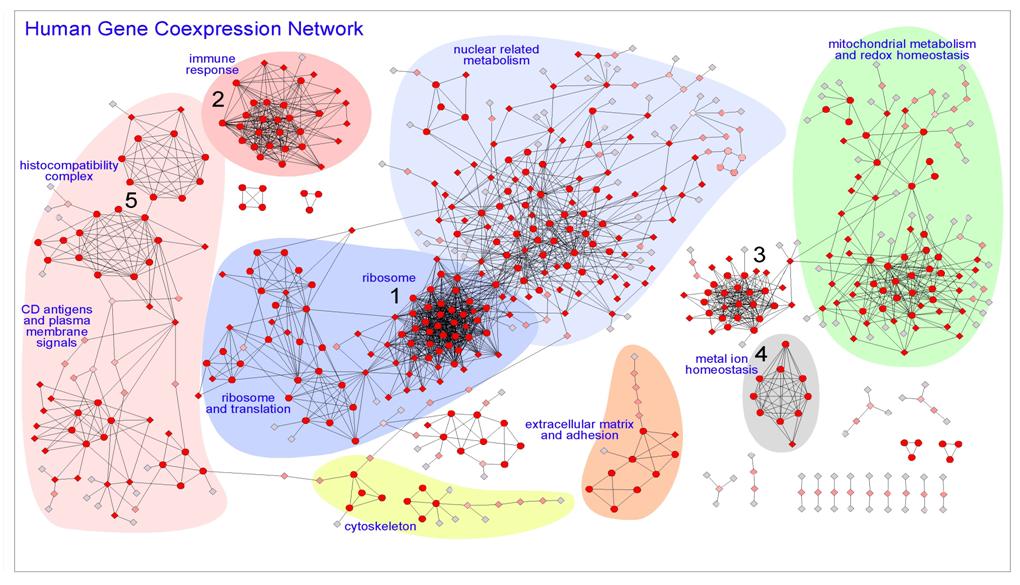
| Graphical view of the coexpression network where the nodes correspond to genes and the edges to coexpression links. The network was produced as the intersection of two datasets (MAS5-Spearman and RMA-Pearson datasets with PPV > 0.60) to provide a confident human coexpression network that includes 615 genes and 2190 pairwise coexpression interactions. The most significant regions have been marked with background colors and labels. The color of the nodes (from red to grey) and the shape (circles or diamonds) were obtained following MCODE algorithm, being: circular nodes, the ones found with high cluster coefficient; diamond nodes, the ones with lower cluster coefficient; intensity of red color, degree of clustering changing till pale grey for the most peripheral nodes that only have one link. |
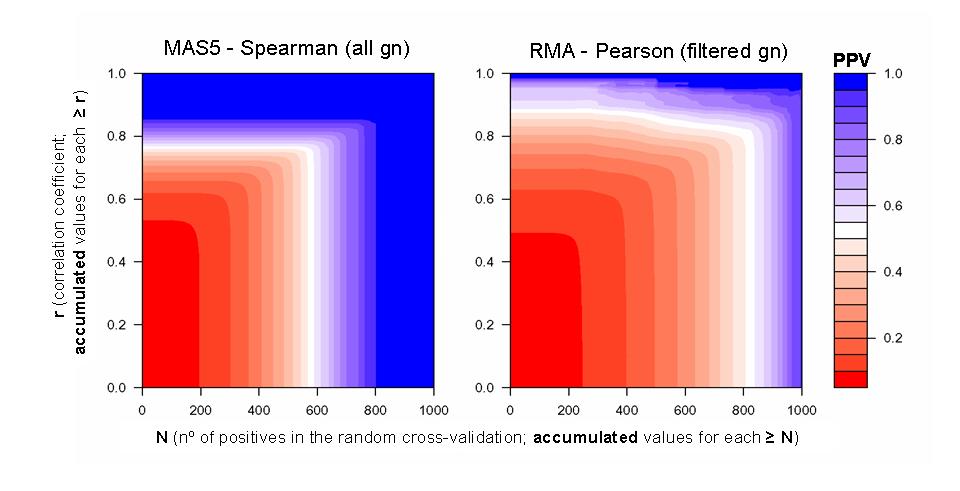
| Color plots of 3 dimensions that represent the Positive Predictive Value (PPV) calculated for each set of gene coexpression data at the different values of correlation coefficient (r) and cross-validation coefficient (N). Calculations are done for data derived from two different methods: MAS5-Spearman without gene filtering and RMA-Pearson with gene filtering. |
| PPV |
Coefficients |
Number Nodes |
Number Links |
|
N |
r |
|||
| MAS5-Spearman (non-Filtered) | ||||
0.60 |
605 |
0.77 |
3052 |
12669 |
0.70 |
645 |
0.79 |
2295 |
7874 |
0.80 |
695 |
0.81 |
1762 |
4910 |
| RMA-Pearson (pre-Filtered) | ||||
0.60 |
765 |
0.85 |
1672 |
5945 |
0.70 |
835 |
0.87 |
1215 |
3273 |
0.80 |
925 |
0.84 |
983 |
2423 |
| The table shows the specific values of correlation and cross-validation for three coexpression datasets derived from each method at three specific PPVs: > 0.60, > 0.70 and > 0.80 (marked as stars within the color plots). The table also shows the number of nodes and links included in each coexpression dataset. |
PPV |
Union |
Intersection |
||||
Number Nodes |
Number Links |
Number Nodes |
Number Links |
|||
0.60 |
3327 |
15841 |
731 |
2249 |
||
0.70 |
2411 |
9264 |
542 |
1447 |
||
0.80 |
1863 |
5935 |
387 |
1008 |
||
| The table shows the number of nodes and links included in each coexpression dataset. Each dataset is derived from the intersection and the union of the data obtained with each method at three specific PPVs: > 0.60, > 0.70 and > 0.80. |