Multiple high density oligonucleotide microarrays provide data to interrogate at once the transcriptomic state of thousands of genes in several biological samples. Gene expression is a tightly regulated process, crucial for the proper functioning of a cell. Alteration of gene regulation often results in up or downregulated genes and the most common analysis strategies look for these differentially expressed genes with an overexpression or a repression tendency. However, molecular disease mechanisms typically constitute abnormalities in the regulation of genes producing strong alterations in the expression levels. The search for such deregulation states in the genomic expression profiles will help to better identify disease-altered genes.
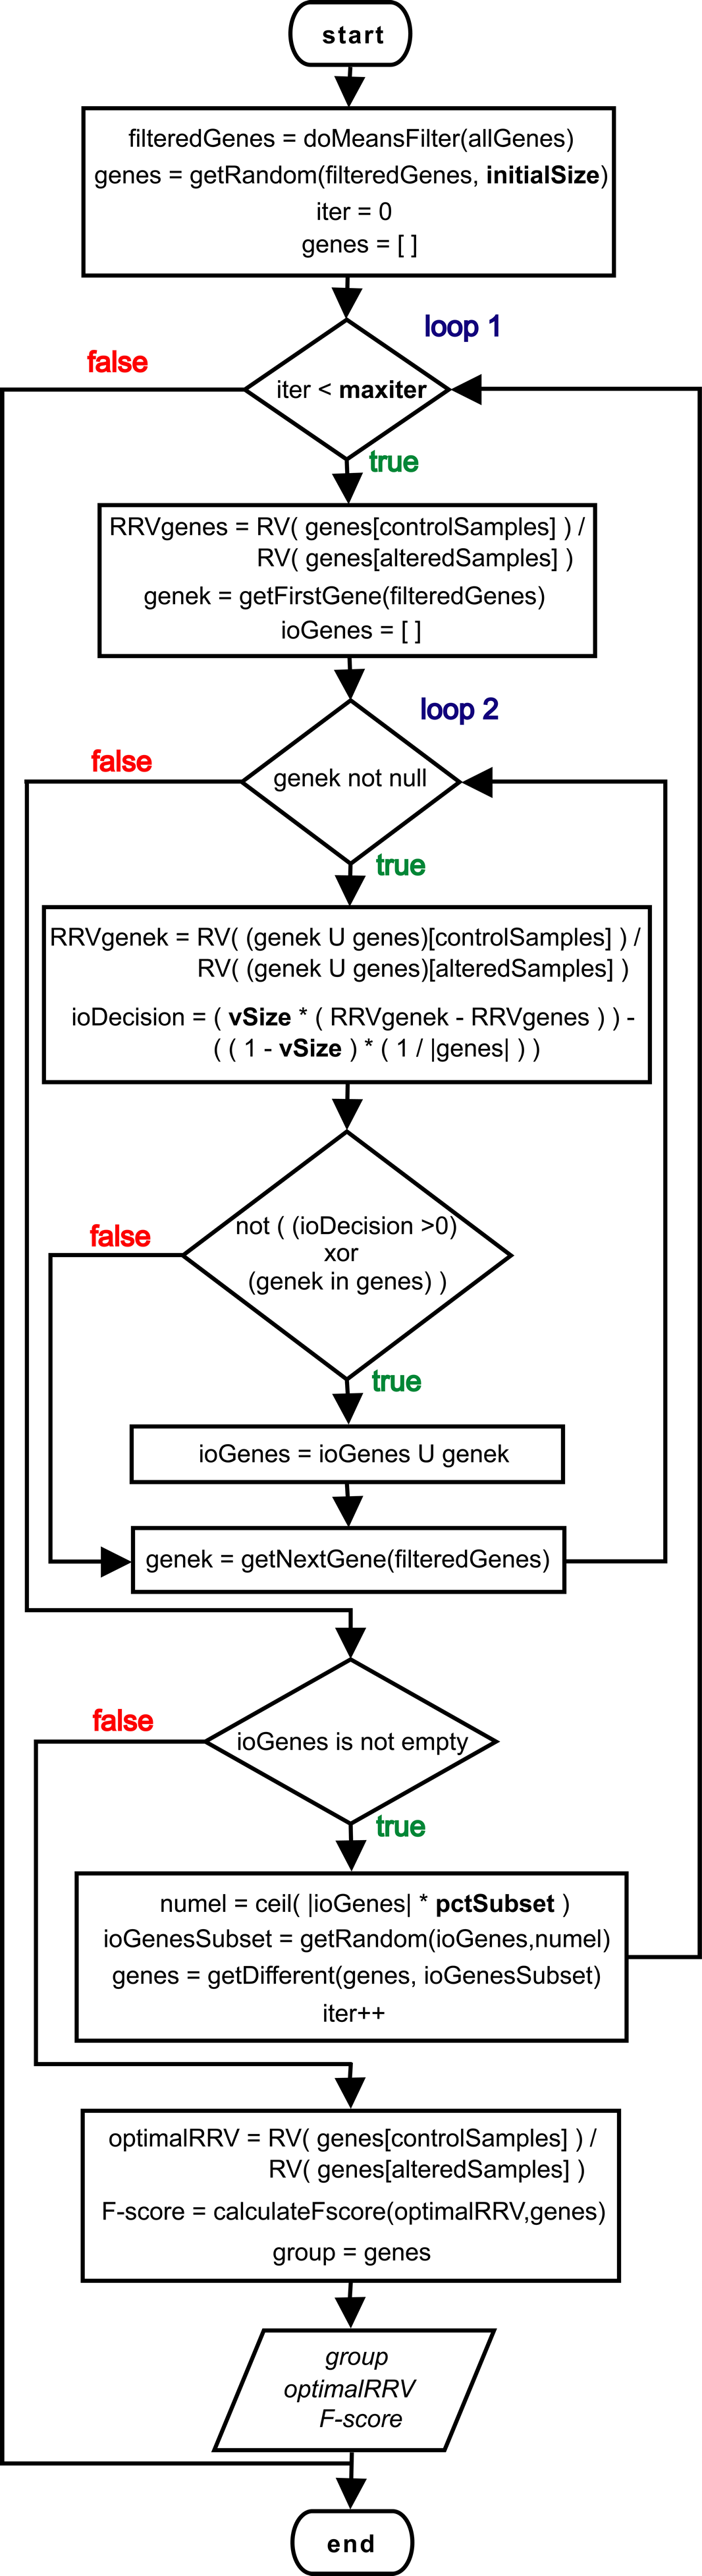
We present a new method that follows a double strategy: an identification of differentially expressed genes followed by a search for groups of genes that present a strong deregulation profile. The method includes a new algorithm that searches for the genes which present the most significant alteration in their expression profiles, by comparing disease samples (i.e. the altered state) with control or healthy samples (i.e. the control state). The algorithm provides groups of genes and assigns a statistical measure of significance to each group. Adequate performance of the method is achieved when the algorithm that finds deregulation is applied to differentially expressed genes previously selected. The method is evaluated using a real experimental set of 16 microarrays from human bone marrow samples: 6 controls and 10 cancer samples from patients with acute promyelocytic leukemia (APL).
The method is implemented in an R package called AlteredExpression, which includes the code of the algorithm and a series of tools to get the data output in tables as html pages easy to handle. The package is available for downloading here. The algorithm will be also made accessible as a package included in the BioConductor project.
Download R Package ExampleThe example shows how to obtain groups of altered genes using an experimental set of 16 microarrays (6 controls and 10 cancer samples), normalized with RMA and processed with SAM algorithm to obtain genes with differential expression. In this way the data includes 1764 genes (as gene probeset processed from Affymetrix) and 16 samples (from 16 microarrays).
# Download the experimental set necessary for the example clicking in this link and store it in your working directory.
# Load the data for the example
data <- read.table("rmaSamM3.csv", sep = "", dec = ".")
# Run the algorithm. This function searchs for three groups
alteredset <- alteredExpressionGroupSet(data,6,numGroups=3)
# Get the class of the object
class(alteredset)
# Get the gene identifiers of the first group.
getAlteredGenes(alteredset,1)
# Get a vector with the F-score values of all the groups generated.
getFscore(alteredset)
# Generates a plot representing the F-score values of all the groups generated.
plotFscore(alteredset)
# Generates an alteredset ordered by F-score.
alteredset.order <- orderAlteredSet(alteredset)
# Generates a plot representing the F-score values of all the groups ordered by F-score.
plotFscore(alteredset.order)
# Generate a HTML file representing the set of groups obtained. View Result
alteredset2html(alteredset.order,"alteredset.html")
# Get the group generated in the first position.
altered <- getAltered(alteredset,1)
# Get the class of the object
class(altered)
# Get the expression values of the group
getExprs(altered)
# Get the gene identifiers of the group
getGenes(altered)
# Generates a group expression plot
plotExprs(altered)
# Geterates a group expression scaled-plot
plotScal(altered)
# Generates a HTML file representing the first group. View Result
altered2html(altered,"altered1.html")
C. Prieto , M.J. Rivas , J.M. Sánchez , J. López-Fidalgo , and J. De Las Rivas.
Algorithm to find gene expression profiles of deregulation and identify families of disease-altered genes.
Bioinformatics Advance Access published on May 1, 2006, DOI 10.1093/bioinformatics/btl053.
Bioinformatics 22: 1103-1110. Pubmed